
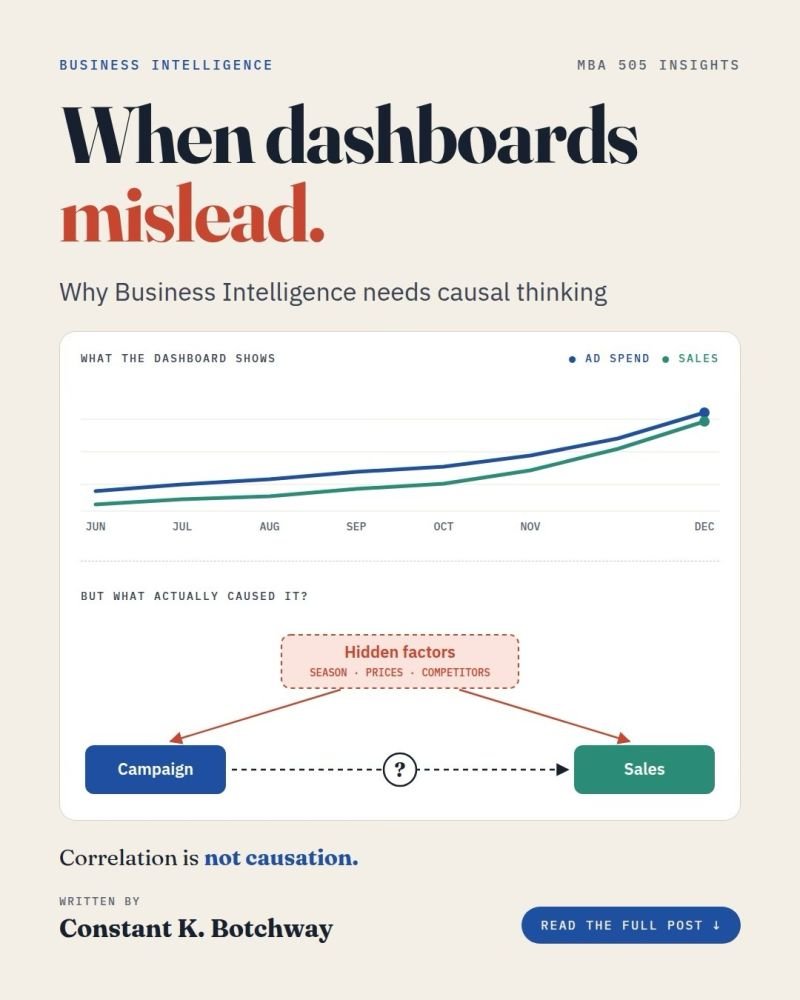
A dashboard can show that sales increased after a new advertising campaign. But did the campaign actually cause the increase?
That question reveals one of the harder problems in Business Intelligence. Dashboards are excellent at showing trends, patterns, and relationships. They are far less reliable when managers use those patterns to make causal claims.
CORRELATION IS NOT CAUSATION
Suppose a company increases advertising expenditure in December and sales rise by 30 percent. The dashboard may show both variables moving upward together.
Management may conclude:
“The campaign increased sales.”
But other explanations may exist. December may already be the strongest sales period. A competitor may have closed. Prices may have changed. Customer demand may have risen for unrelated reasons.
The relationship may be real, but the cause is still uncertain. Pearl and Mackenzie argue that observing an association is different from establishing what would happen if a decision-maker deliberately changed one factor (Pearl and Mackenzie 2018).
FROM DESCRIPTION TO EXPLANATION
Traditional Business Intelligence often answers questions such as:
What happened?
Where did it happen?
Which product performed best?
How did this quarter compare with the previous one?
Causal thinking asks something more demanding:
What actually produced the result?
This requires attention to confounding variables, comparison groups, experiments, alternative explanations, and counterfactual reasoning.
A counterfactual asks:
“What would have happened if we had not taken this action?” Hernán and Robins explain that causal inference depends on comparing what actually happened with a credible estimate of what might have happened under another condition (Hernán and Robins 2020).
WHY THIS MATTERS FOR MANAGEMENT
Consider employee training.
A dashboard may show that employees who attend more training programmes are more productive.
If management confuses association with causation, it may invest heavily in an intervention without knowing whether it actually works.
This is why Business Intelligence should move beyond displaying KPIs and begin asking how actions, outcomes, risks, and organisational goals are causally connected.
CONCLUSION
A dashboard can tell leaders that two things happened together.
It cannot automatically prove that one caused the
The next level of Business Intelligence is therefore not only better visualisation.
It is better reasoning about cause and effect.
The critical question is:
“Did this action really produce the result, or does the dashboard merely make it look that way?”
REFERENCES
Hernán, Miguel A., and James M. Robins. 2020. Causal Inference: What If. Chapman & Hall/CRC.
Pearl, Judea, and Dana Mackenzie. 2018. The Book of Why. Basic Books.
Provost, Foster, and Tom Fawcett. 2013. Data Science for Business. O’Reilly Media.